The Story of Data
At the end of April, I received an email stating I had received a scholarship from DataQuest to work through the Data Analytics program they offer. It's an online course that teaches the skills needed to move on to working in Data Analytics. This is what I had been waiting for! In the midst of the pandemic, I had received something that would help me see the world in a different view. This scholarship is so much more than that, it gave me the feeling of someone believing in me and the way I see the world. 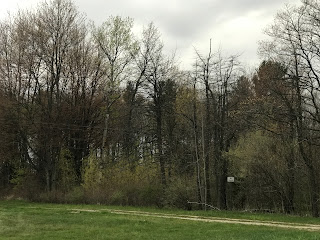
Most people see the clump of trees that I run by and see all the trees. Data Analytics give you an ability to see the trees as individual and use the patterns they produce to tell you so much more about them and how they interact with the world. It's not just important to see the big picture but to separate out the parts of it and see what it means. Although these trees look like a clump at the end, each one is changing color at a different rate. Each one is working in tandem with those around one. One tree does not rely on itself alone but the system it creates.
To me, this is data. Data is made up of individual parts but they work together. Sometimes it is hard to figure out how they work but that's where Data Analysis comes into play. By working through the data one is able to find patterns and relationships that may not have been realized previously. When working with data the pictures come to life as do the relationships. The opportunity to tell the story of the data is huge and one I'm working towards in a variety of ways.
I look through my own data on a regular basis. I keep running data, budget data, and data for work. All of this tells a story - the good and the bad and I can see relationships between my mood, experiences and how I work through them. This all comes from seeing the data, not as a bunch of numbers but as a story, the story that needs to be told after recognizing patterns. This may not seem exciting but the opportunity DataQuest has given me is one I won't take lightly as it's a way to combine the love of storytelling and the fascination with data. This will be part of my story...and my data history.

Comments
Post a Comment